OLEX 10.9
OLEX 10.9 released
Norwegian based OLEX AS, the manufacturer of complete systems for navigation, plotting and 3D seafloor mapping, is pleased to announce that OLEX 10.9 is now released and available as a free download or through your local Olex dealer for an upgrade of your system.
This latest software version might be the most comprehensive OLEX upgrade ever. Lots of new stuff, and more is to come. New plotter functions allow moving, copying, scaling and rotating groups of plotter objects, in addition to easy plotting of circles, squares and rectangles. The new version comes with better support for large amounts of data like AIS targets and seafloor data sets, ice-charts for northern waters, improved plotter data conversion and much more. In a bit more detail the new features available in OLEX 10.9 software version are:
- Moving, copying, scaling and rotating groups of plotter objects
- Plotting of circles, squares and rectangles
- Supports ice charts from Met.no and Barents Watch
- Better support for large amount of AIS data
- Inland AIS data parameters
- Optional smoothing of course and speed
- Cleaner autopilot interfacing
- Includes all NMG charts from NGU
- Better ergonomics around raster charts
- Able to import huge sets of bottom data or XYZ files
- Minor: ChartWorld ACES, individual URL downloads, large bathy imports
- Minor: No SSL certificate option, wave heights in feet or meters
- Minor: Better interpolation of position, if active
- Minor: Atec-200 firmware 4.7.206, better import of foreign plotter data
- Minor: Atec internal pressure, Autonav
- Bug fixes: Hot bathy colors
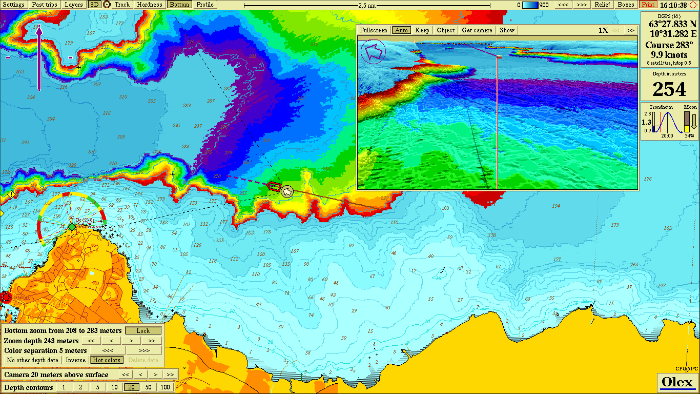
After years of research, development and testing, OLEX AS has developed and keeps refining the most comprehensive seafloor topography mapping system available on the market. OLEX systems are based on Linux, and are considered to be the most stable systems of their kind available on the commercial market. Speed, flexibility and user-friendliness are important keywords to explain their success.
OLEX can use official and unofficial vector charts, in S57, shape and SOSI format, from Hydrographic Offices and commercial vendors. The navigation charts are displayed alongside the collected seabed data and the chart visualization software will, always strive to achieve a clear and informative chart image and prevent the screen from filling up with unnecessary information, by displaying only information relevant to the current zoom scale. Zooming and chart display are fast, easy and seamless.
For further information you may contact the Official Distributor and Support Center for Greece and Cyprus:
Aegean Electronics SA
4 Zosimadon Str, Piraeus 185 31, Greece
Tel: +30 210 4123000
E-mail: info@aegeanel.com
Recent Posts
- SEA.AI Sailing Software Update v8.0
- B&G released new software for Nemesis
- Simrad introduces new HS65 Satellite Compass
- Anschütz Std22NX gyrocompass with 3-years warranty
- Simrad launched ECS900 Electronic Chart System
- ShipModul released firmware V3.20.0 for MPXConfig3
- New SYNAPSIS software enhances bridge performance
- Simrad SY60 a new 8-inch Omni Sonar
- OLEX releases version 17.11
- ShipModul released firmware V3.38.x for MiniPlex-3
- Echoview 16.1 is out now!
- B&G® announced the new Zeus®SRX
- SAILOR 4065 EPIRB GNSS/AIS is launched
- Simrad released s.v.26.1 for NSS & NSO evo3/3S
Archives
- July 2026
- June 2026
- May 2026
- April 2026
- March 2026
- February 2026
- January 2026
- December 2025
- November 2025
- October 2025
- September 2025
- August 2025
- July 2025
- June 2025
- May 2025
- April 2025
- March 2025
- February 2025
- January 2025
- December 2024
- November 2024
- October 2024
- September 2024
- August 2024
- July 2024
- June 2024
- May 2024
- April 2024
- March 2024
- February 2024
- January 2024
- December 2023
- November 2023
- October 2023
- September 2023
- August 2023
- July 2023
- June 2023
- May 2023
- April 2023
- March 2023
- February 2023
- January 2023
- December 2022
- November 2022
- October 2022
- September 2022
- August 2022
- July 2022
- June 2022
- May 2022
- April 2022
- March 2022
- February 2022
- January 2022
- December 2021
- November 2021
- October 2021
- September 2021
- August 2021
- July 2021
- June 2021
- May 2021
- April 2021
- March 2021
- February 2021
- January 2021
- December 2020
- November 2020
- October 2020
- September 2020
- August 2020
- July 2020
- June 2020
- May 2020
- April 2020
- March 2020
- February 2020
- January 2020
- December 2019
- November 2019
- October 2019
- September 2019
- July 2019
- June 2019
- April 2019
- March 2019
- February 2019
- January 2019
- December 2018
- November 2018
- October 2018
- September 2018
- July 2018
- June 2018
- May 2018
- April 2018
- March 2018
- February 2018
- January 2018
- December 2017
- October 2017
- February 2017
- January 2017
- April 2016